How to trade in low volatility conditions
23 November 2022The market in recent months has created exceptionally difficult conditions to trade. Low volatility and obscure price action has reduced the volatility available for traders to capitalise on. These conditions have affected FOREX, Equity, and Index trading. It has been specifically difficult for momentum and trend following traders as a certain level of volatility is needed for trader to return profitable trades.
How to spot low volatility
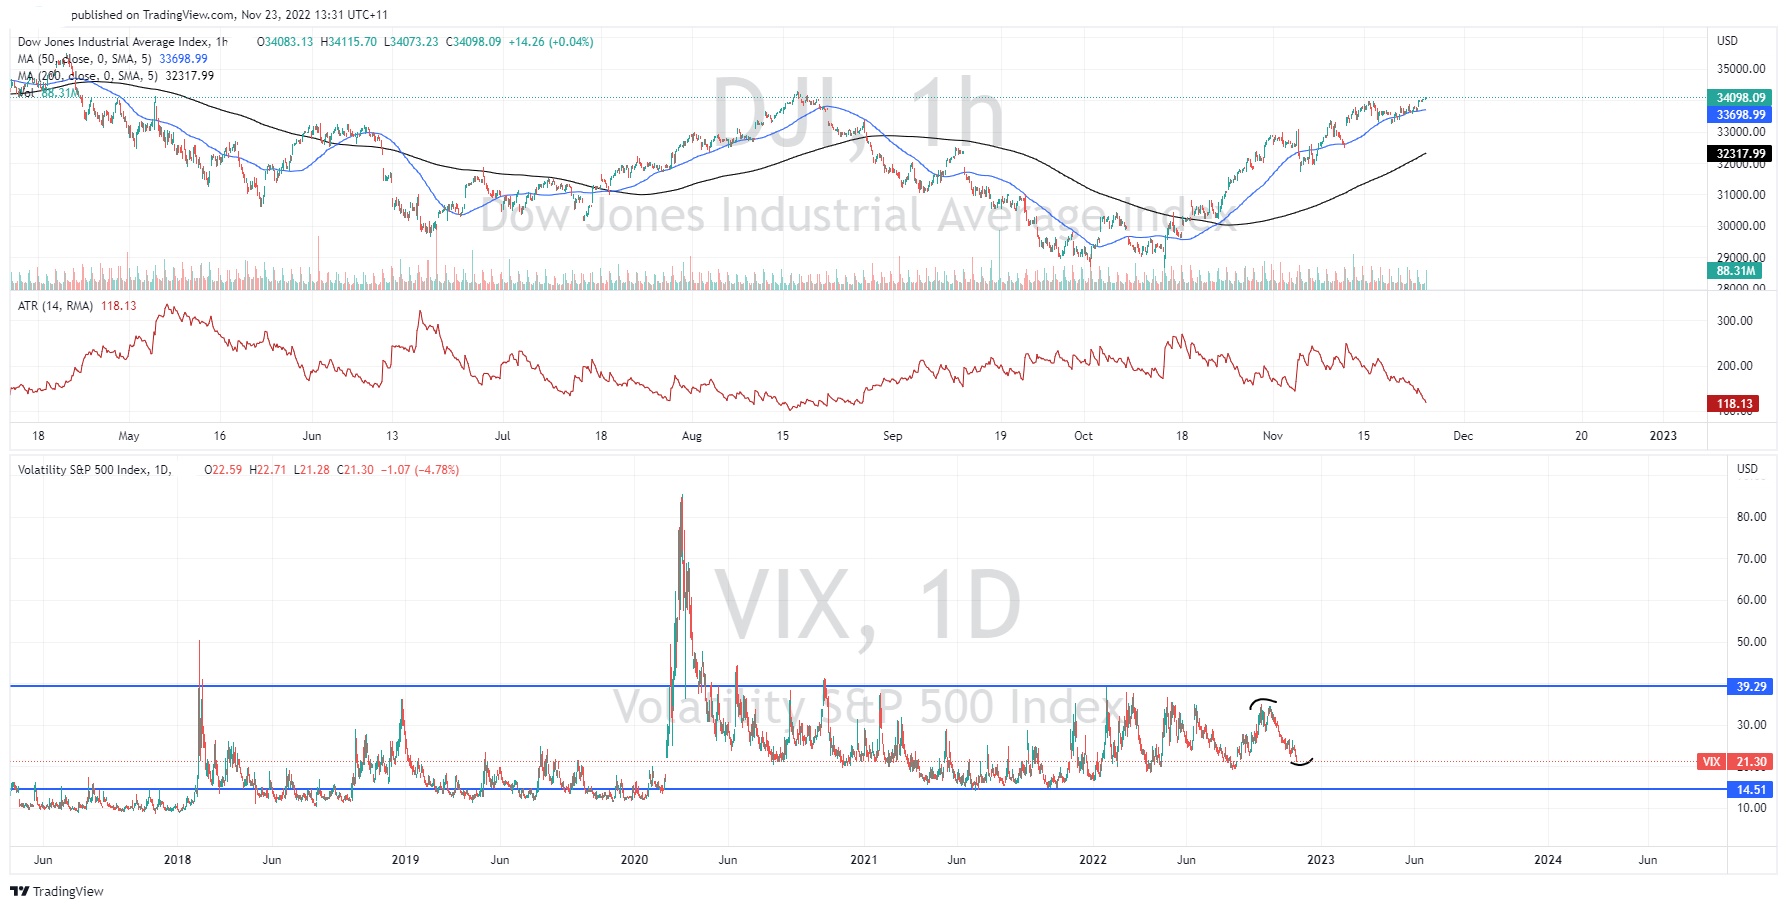
The Average True range or ATR range can be an important indicator in determining the level of volatility in a market or asset. It measures the average trading range of a particular asset’s price over a period. It can exceptionally be helpful in determining how volatile the asset is at a certain point in time, or how volatile an asset is compared to another one. For instance, looking at the ATR for the Dow Jones, it has been getting progressively lower and is at its lowest level since August indicating a reduction in volatility.
The Market Volatility Index or the VIX measures volatility across the S&P 500 is also an important indicator to not just gauge market volatility, but also general market sentiment and emotion. When fear and greed are prominent in the market volatility tends to increase and when they dissipate, they tend to decrease. As the chart shows, volatility has been reducing to levels not seen since the rally in August 2022. The characteristics of the chart are also interesting as the VIX acts much more in waves then other indices do.

How can you optimise your trading during periods of low volatility?
Tips for trading in low volatility markets
- Understand that breakouts will fail. Specifically for traders who like to use strategies based on momentum breakouts, during times of low volatility the price means to stay close to moving averages and mean price points both on an intra and inter day level.
- Wait for confirmation before a momentum move. Although breakouts are less common in low volatility markets, they do still occur. In this instance, it is ideal to wait for a confirmation or retest of an important level before entering trades. Confirmation can be supported by strong candle in support or increased volume.
- Being patient is essentially in times of low volatility. Opportunities that may have otherwise eventuated may be more difficult to come by. Utilising volume and strong candlesticks as secondary entry triggers can help manage emotions and remain patient.
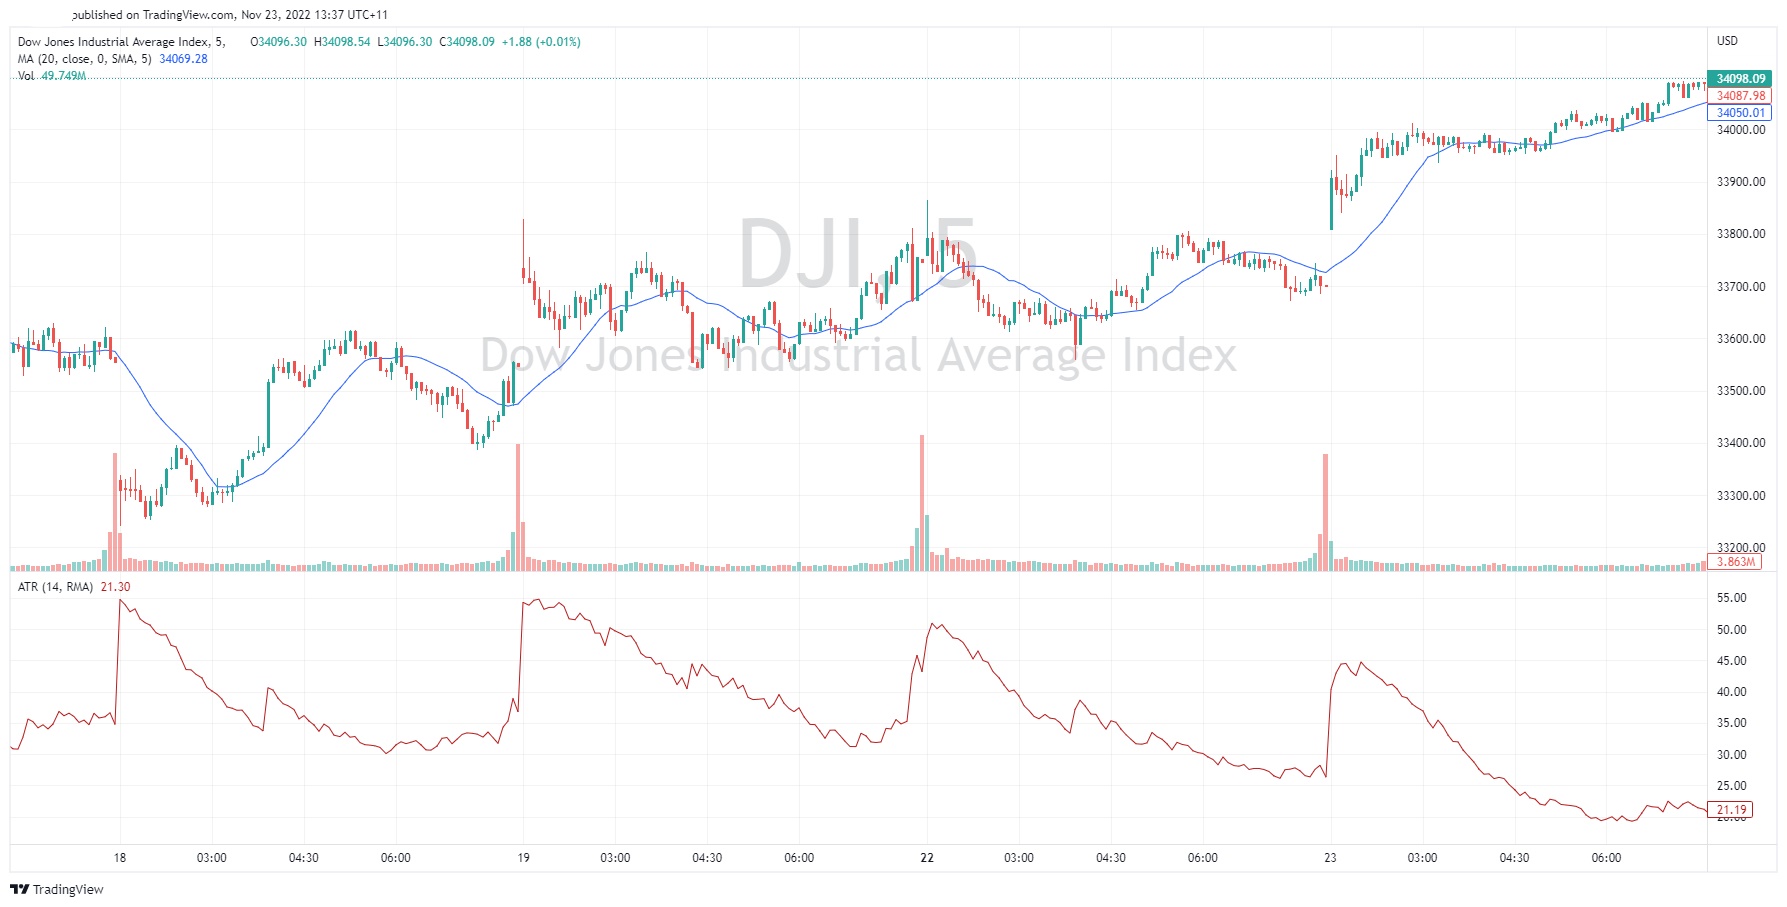
- Price tends to stay close its mean. This means that if a price does break out or break down, the price often swings back to the mean. The mean may be a simple moving average, Volume Weighted Average, or some other measure. In essence it does not really matter what is used, rather than the price tends to retrace back to the mean in some manner. Therefore, these conditions lend themselves to mean reversion systems or strategies. As seen on the chart below, the price has reverted to the 20-period moving average on multiple occasions.
- Using multiple time frame analysis for identifying support and resistance. As previously stated, when there is low volatility, finding real breakouts that will last becomes more difficult. By ensuring that the breakouts or breakdowns in price are occurring across multiple timeframes a trader can enhance their chance of it being sustained as their will likely be a higher level being traded at longer term levels.

Trading can be difficult during periods of low volatility. However, this does not mean traders should not trade. Rather, traders should be aware of potential obstacles and difficulties that may arise and the strategies that can help work though these difficulties.
Disclaimer: Articles are from GO Markets analysts and contributors and are based on their independent analysis or personal experiences. Views, opinions or trading styles expressed are their own, and should not be taken as either representative of or shared by GO Markets. Advice, if any, is of a ‘general’ nature and not based on your personal objectives, financial situation or needs. Consider how appropriate the advice, if any, is to your objectives, financial situation and needs, before acting on the advice.
Next Article
Shares of Deere rise as financial results exceed expectations
Shares of Deere rise as financial results exceed expectations Deere & Company (NYSE: DE) announced financial results on Wednesday for the fourth quarter that ended on October 30, 2022. The US manufacturer of farm machinery and industrial equipment reported revenue of $15.536 billion for the quarter, which was above analyst forecast of $13...
Previous Article
Stocks, commodities and cryptos bounce, USD dips as risk-on returns
Another low volatility, quiet news day saw risk assets reverse Monday’s price action with US equities steadily rising throughout the session on lack...


