
Technical Analysis – Retracement for US Dollar
7 October 2022Starting from the weekly timeframe, US Dollar Index has been consistently trending upwards for the last 16 months. Using the 9 exponential moving average (EMA) on the weekly time frame, we can see the US Dollar retracing back to the EMA, bouncing off of it, then continuing with the trend, as seen below:
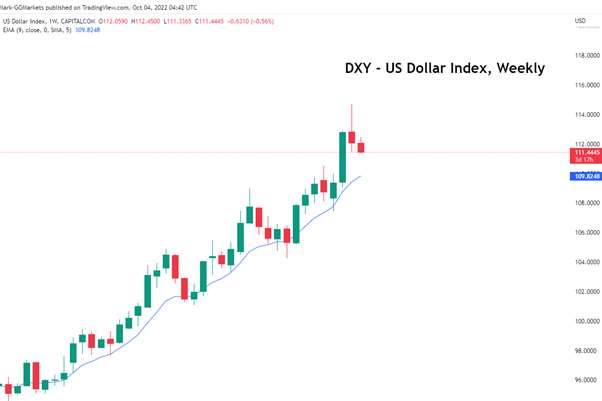
Looking at the structure of the uptrend, last week’s candlestick closed bearish, perhaps signalling a retracement back to the 9 EMA on the weekly time frame.
Breaking down the movements of the uptrend, generally the higher highs create a floor for the pullback. For example:
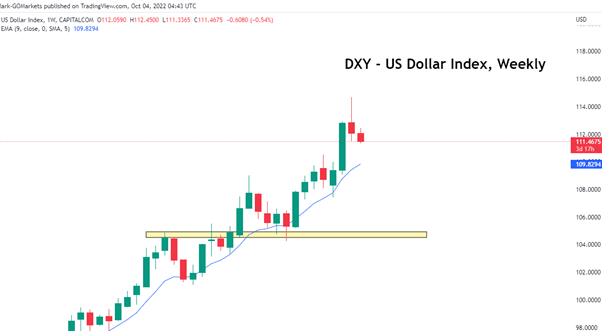
Taking this into consideration, if the US Dollar continues to retrace back to the 9 EMA, the last higher high can be used as a base level for the potential floor, or the end of the retracement:
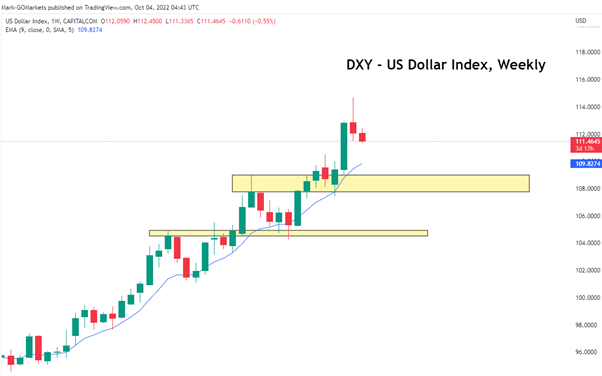
The range is between $108.45 to $109 as the potential target for the US Dollar.
Disclaimer: Articles are from GO Markets analysts and contributors and are based on their independent analysis or personal experiences. Views, opinions or trading styles expressed are their own, and should not be taken as either representative of or shared by GO Markets. Advice, if any, is of a ‘general’ nature and not based on your personal objectives, financial situation or needs. Consider how appropriate the advice, if any, is to your objectives, financial situation and needs, before acting on the advice.
Next Article
GO Markets Announced as Kooyong Classic 2023 Partner
FRITZ, CILIC JOIN ALCARAZ AND DE MINAUR AT CARE A2+ KOOYONG CLASSIC GO MARKETS ANNOUNCED AS NEW PARTNER Top-ranked American Taylor Fritz and former US Open Champion Marin Cilic are the latest headline acts for the Care A2+ Kooyong Classic in 2023, with Australian-owned online brokerage, GO Markets also announced as a new tournament partner. Fr...
Previous Article
US stocks dump and pump as strong data cools Fed-pivot hopes
US equities declined after a record two day winning streak, a volatile and choppy session ultimately ending with the S&P500 down 7.65 points (0.2%...