- Trading
- Trading
- Markets
- Markets
- Accounts
- Accounts
- Platforms & tools
- Platforms & tools
- Platforms
- Platforms
- Premium trading tools
- Premium trading tools
- Education
- Education
- Resources
- Resources
- Help & support
- Help & support
- About
- About
- Client support
- Trading
- Trading
- Markets
- Markets
- Accounts
- Accounts
- Platforms & tools
- Platforms & tools
- Platforms
- Platforms
- Premium trading tools
- Premium trading tools
- Education
- Education
- Resources
- Resources
- Help & support
- Help & support
- About
- About
- Client support
- For bullish breakouts: The stop goes below the breakout candle or below the prior swing low.
- For bearish breakouts: The stop goes above the breakout candle or above the prior swing high.
- Targeting the next logical resistance (bullish) or support (bearish) level
- Using a fixed risk-reward ratio (e.g., 2 or 3:1)
- Trailing stops along a moving average (e.g., the 14 EMA).
- Variation: Some suggest a close beneath this (rather than just a touch) may be worth exploring as a variation.
 News & Analysis
The Fractal Breakout – Trading Setups
8 September 2025Rather than looking for a reversal, fractal breakouts use the last fractal high (in an uptrend) or last fractal low (in a downtrend) as confirmation of a trend after a retracement in price
It is a continuation strategy designed to capture momentum once the price has confirmed direction. When price breaks beyond the most recent fractal, it signals that the prevailing trend has the strength to continue.
Bullish Fractal Breakout
A bullish fractal breakout occurs when price pushes above the last swing high (marked by a fractal). This indicates buyers have overcome the previous barrier, and the uptrend may continue after a small pullback in price.
Confirmation is strengthened when the breakout candle also closes above both the 14 EMA and the 200 EMA, showing alignment of short-term momentum with long-term trend direction.
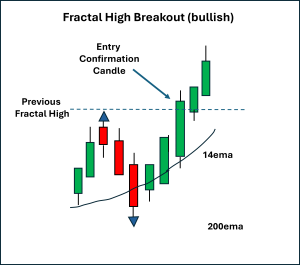
A: Prior uptrend (bull candles) → sustained buying pressure pushing toward resistance.
B: Fractal high → the last swing high marked by a fractal, acting as a breakout trigger.
C: Breakout candle → strong bullish candle closing ABOVE the fractal high (and ideally above both 14 EMA and 200 EMA).
You can see a real chart example of this on the 1-hourly Gold (XAUUSD) CFD chart:
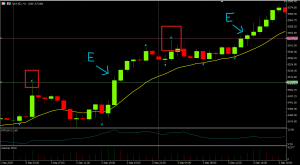
Red squares show the last fractal of note. “E” shows where the entry points could be placed Bearish Fractal Breakout
A bearish fractal breakout occurs when price pushes below the last swing low (marked by a fractal).
This shows that sellers have reconfirmed control after a small retracement, and the downtrend is likely to continue.
As with the bullish version, the signal is considered stronger if the breakout candle also closes below both the 14 EMA and the 200 EMA.
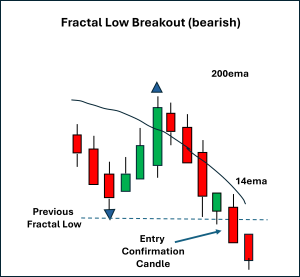
A: Prior downtrend (bear candles) → sustained selling pressure pushing toward support.
B: Fractal low → the last swing low marked by a fractal, acting as a breakout trigger.
C: Breakout candle → strong bearish candle closing BELOW the fractal low (and ideally below both 14 EMA and 200 EMA).
You can see a real-world example of this on the 1-hourly EURUSD chart:
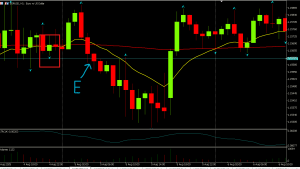
Red squares show the last fractal of note. “E” shows where the entry points could be placed Stop Placement and Exits for Fractal Breakouts
Stops are logically placed on the opposite side of the breakout fractal:
Exits can be managed by:
The combination of fractals with moving averages can assist in avoiding weaker signals, but a failure to follow through on this concept is at the basis of exit approaches.
Final Thoughts
The fractal breakout setup is a clean and structured way to trade with the trend. It provides confirmation that buying pressure still exists, even after a recent pullback in price.
By waiting for price to confirm beyond the last fractal point, rather than the common “buy on the dip,” you can avoid premature entries and align with the story that price action is telling you.
Adding moving average filters, such as the 14 EMA for momentum and the 200 EMA for long-term bias, can significantly improve reliability, though different combinations may suit different market types and timeframes.
Like all strategies, it will not always go in your favour, and even if it does, you should endeavour to reduce the amount of “give-back” of potential profit.
Breakout ideas can fail, especially in choppy conditions. Risk management and unambiguous pre-defined exit criteria are essential — the only real failure is when you fail to have these in place or fail to execute your risk management.
Ready to start trading?
Disclaimer: Articles are from GO Markets analysts and contributors and are based on their independent analysis or personal experiences. Views, opinions or trading styles expressed are their own, and should not be taken as either representative of or shared by GO Markets. Advice, if any, is of a ‘general’ nature and not based on your personal objectives, financial situation or needs. Consider how appropriate the advice, if any, is to your objectives, financial situation and needs, before acting on the advice.
Next Article
The Outside Bar – Trading Setups
The outside bar is a powerful price action pattern that often signals a potential reversal. Unlike single-wick setups such as a pinbar strategy, the outside bar forms when a candle’s high and low both exceed those of the prior candle, effectively “engulfing” it completely. This wide-ranging bar represents a change in buying or selling...
September 11, 2025Read More >Previous Article
Pinbar Reversal – Trading Setups
The pinbar reversal is one of the most-used price action signals in trading. It reflects a battle between buyers and sellers where one side attem...
August 28, 2025Read More >
- Trading
- Trading
- Trading
- Markets
- Markets
- Products overview
- Forex
- Commodities
- Metals
- Indices
- Share CFDs
- Cryptocurrencies
- Treasuries
- ETFs
- Accounts
- Accounts
- Compare our accounts
- Our spreads
- Funding & withdrawals
- Open CFD account
- Try free demo
- Platforms & tools
- Platforms & tools
- Platforms
- Platforms
- Platforms overview
- TradingView
- MetaTrader 4
- MetaTrader 5
- Mobile trading platforms
- Premium trading tools
- Premium trading tools
- Tools overview
- VPS
- Genesis
- Education
- Education
- Resources
- Resources
- News & analysis
- Education hub
- Economic calendar
- Earnings announcements
- Help & support
- Help & support
- About
- About
- About GO Markets
- Our awards
- Sponsorships
- Client support