- Trading
- Trading
- Markets
- Markets
- Accounts
- Accounts
- Platforms & tools
- Platforms & tools
- Platforms
- Platforms
- Premium trading tools
- Premium trading tools
- Education
- Education
- Resources
- Resources
- Help & support
- Help & support
- About
- About
- Client support
- Trading
- Trading
- Markets
- Markets
- Accounts
- Accounts
- Platforms & tools
- Platforms & tools
- Platforms
- Platforms
- Premium trading tools
- Premium trading tools
- Education
- Education
- Resources
- Resources
- Help & support
- Help & support
- About
- About
- Client support
 News & Analysis
Monitoring Volatility and Spotting Trading Opportunities
25 July 2018US Markets
With relatively sound fundamentals driven by strong earnings growth so far in this earning season, US equity markets have continued their bullish trend. The S&P500 bounced back strong from its 100-day moving average in early July, and by going over the 2800 level, it seems to be on track to reach its all-time high of 2870, possibly even winning new grounds.
Chart 1 : US S&P 500
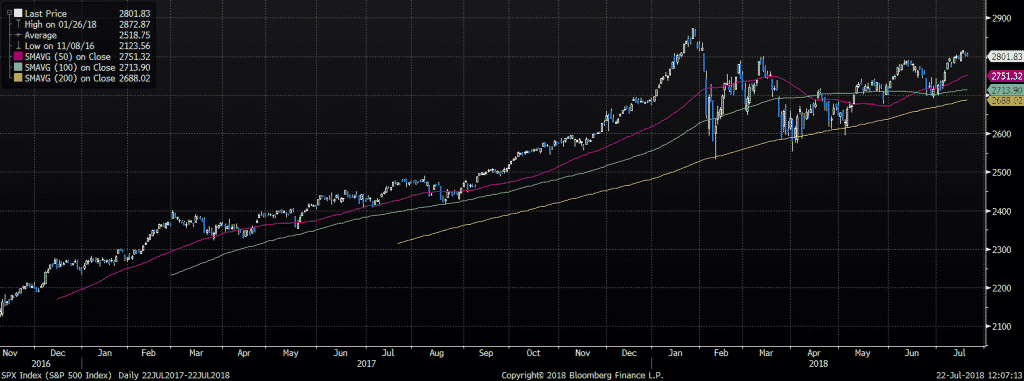
Whilst it is hard to make a case against the trend above, we also want to be ready for when markets descend into a (possibly overdue) correction phase. UBS has recently released a note suggesting we are going to see some serious pain should the tariff war between U.S and China intensify. They also argue that the current rate of tariffs has minimal impact on the markets, but if the U.S takes it to the next level by putting a 10% tariff on US$200 billion worth of imports from China, then the S&P500 would most likely be hit by a 10% decline. They also predict that the S&P500 could drop by an additional 10 percent (a total of 20%) if the current situation between U.S and China escalates into a full-blown trade war.
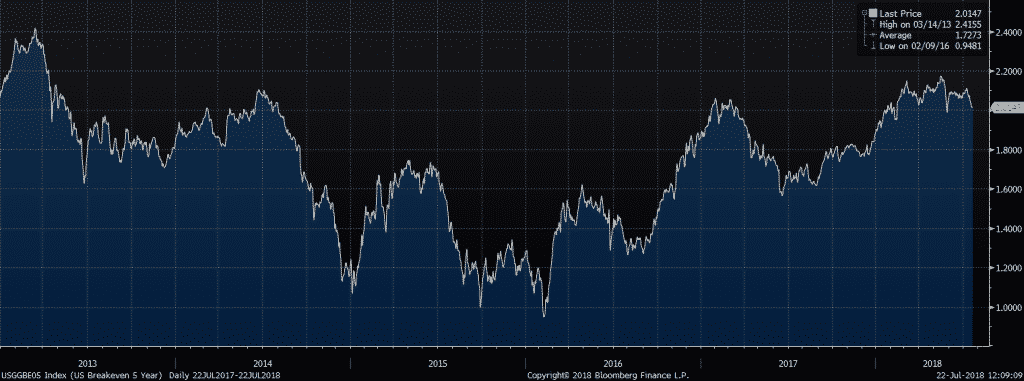
On a macroeconomic level, we note that the difference between short term and long term interest rates is narrowing down rapidly. This phenomenon, also known as yield-flattening, is usually seen as a signal that long-term growth is potentially not as strong as short-term growth. When yield-flattening turns into yield-inversion (where short-term rates are higher than long-term rates) and is combined with increasing cost of borrowing for companies, higher inflation, and rising unemployment, it can be a serious sign of an upcoming recession. Inflation expectations have somewhat stalled over the past few months, but as shown in the chart below they are on a clear strong upward trend.
Chart 2: U.S five year break even (inflation expectation)
US unemployment seems to be stable, but corporate borrowing costs are moving higher. Therefore, while traders enjoy the current calm they should also be on the watch for signs of risk. This article primarily allows readers to understand better risk monitoring; by undertaking a historical analysis, we show some instruments’ sensitivity to volatility.
Monitoring Risk:
A common way to monitor market risk is to monitor volatility. In simple terms, you can think of volatility as the range of candlesticks in your candlestick chart. In the more volatile periods, the candlestick ranges are larger, and in the less volatile periods, the candlestick ranges are smaller; as volatility is the magnitude of price swings whether upwards or downwards.
Reading candlestick charts or price swings to determine the state of volatility is seen as backward looking. That means you would be only limited to past information to make an inference about the future state of the markets — This can be problematic for traders. The Volatility Index measures the implied volatility as opposed to historical (or so called realized volatility). It is a forward-looking measure and roughly estimates how much volatility traders are incorporating into their pricing models.
One of the reasons volatilities are so important to watch is that high volatilities will usually cause stock markets to fall rapidly. With stocks falling fast, investors will switch to a risk-off mode, which in turn has a follow-on impact on all other markets including currencies, commodities, etc.
To better see how the VIX affects other markets, we have selected 5 scenarios in Chart 3 where volatility has significantly jumped up over the past ten years.
Chart 3: VIX over the past 10 years
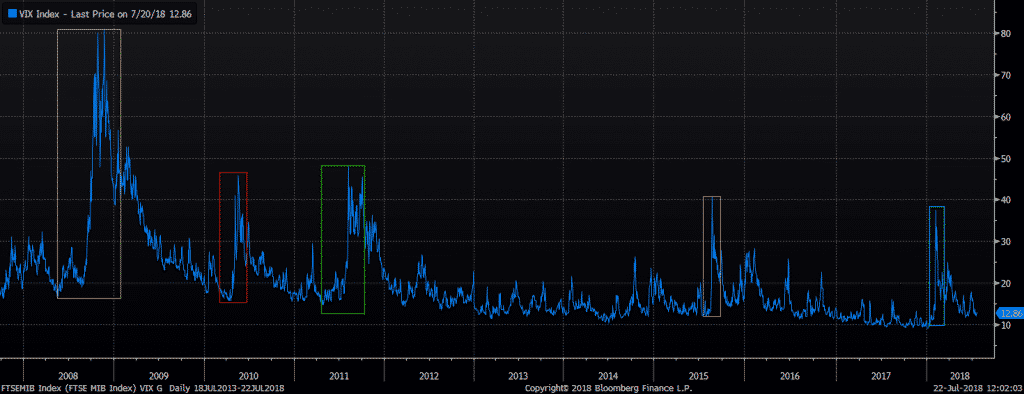
Table 1 shows the duration of each period and subsequent fall in the S&P500. The last column in this table measures how fast the market has fallen over the volatility period. During the GFC, the market fell on average 0.15% per day for almost 367 trading days.
Table1: Volatile Periods and their impact on S&P500
(measured close to close)
Period Start Period end No of Days Change in S&P Average %Drop per business day Scenario 1 11/10/2007 6/03/2009 367.00 -56% -0.15% Scenario 2 26/04/2010 1/07/2010 49.00 -15% -0.31% Scenario 3 7/07/2011 4/10/2011 64.00 -17% -0.26% Scenario 4 19/08/2015 11/02/2016 127.00 -12% -0.09% Scenario 5 26/01/2018 9/02/2018 11.00 -9% -0.80% Source: Bloomberg
Let’s explore how asset classes have performed during these scenarios.
Equity Indices: Watch the Nikkei
We may have heard that correlations go to 1 during crises. This means that if a major risk event were to hit one corner of the world markets, others would be affected too. The table below shows that each time the S&P has sneezed (or gotten sick during the GFC) the rest of the world followed suit.
Table 2: Performance of major indices during crises
(measured close to close)
S&P 500 DAX 30 FTSE 100 ASX 200 Nikkei 225 Scenario 1 -56% -54% -47% -50% -59% Scenario 2 -15% -7% -16% -13% -18% Scenario 3 -17% -30% -18% -15% -16% Scenario 4 -12% -18% -14% -8% -22% Scenario 5 -9% -9% -7% -3% -10% Source: Bloomberg
With the exception of Scenario 3, the Nikkei 225 has almost always dropped more than the U.S market. This means that traders would have received a bigger bang for their buck should they chose to short Japan 225 in risk-off environments. Interestingly, ASX 200 has been a better performer than S&P 500 in times of crises.
Precious Metals: Gold and Platinum
We previously wrote about how Gold historically turns into a safe haven asset during crisis periods, as depicted in the table below. Unlike Gold, platinum does not hold up during these times, and in fact seems to have been instead highly correlated with stocks — an interesting fact for pair-traders.
Table 3: Performance of Precious metals during crises
(measured close to close)
Gold Silver Platinum Scenario 1 26% -3% -24% Scenario 2 4% -3% -14% Scenario 3 6% -17% -15% Scenario 4 10% 3% -5% Scenario 5 -2% -6% -5% Source: Bloomberg
Energy: A case for short-sellers?
During crises all energies can drop quite significantly. Specifically, let’s look at WTI, Brent, and Natural Gas. On average Oil tends to drop a bit more than Nat Gas, but the gap is not wide enough to make Oil a prime shorting candidate.
Table 4: Performance of energies during crises
(measured close to close)
Oil (Crude) Oil Brent Natural Gas Scenario 1 -45% -44% -43% Scenario 2 -13% -17% 14% Scenario 3 -23% -16% -12% Scenario 4 -36% -36% -27% Scenario 5 -10% -11% -26% Source: Bloomberg
Currencies: Commodity currencies once more
We have previously written about how USD, CHF and JPY become safe haven currencies during crises. Seeing the US Dollar Index and JPY going higher was not a surprise for us, but it is quite interesting to see the magnitude of AUDJPY’s drop, as it underperformed all other currencies in this analysis. The last row of Table 4 shows the average drop per currency. The AUDJPY ‘s average decline is almost twice (or even more) that of others.
Table 4: Performance of currencies during crises
(measured close to close)
USD index EURUSD AUDUSD JPYUSD GBPUSD CHFUSD AUDJPY AUDEUR CADUSD Scenario 1 13% -11% -29% 19% -31% 2% -40% -20% -24% Scenario 2 4% -6% -9% 7% -2% 1% -15% -3% -6% Scenario 3 6% -7% -11% 6% -3% -8% -16% -4% -9% Scenario 4 -1% 2% -3% 10% -8% -1% -12% -5% -6% Scenario 5 2% -1% -4% 0% -2% -1% -3% -2% -2% Average (including GFC) 5% -5% -11% 8% -9% -1% -17% -7% -9% Average (not including GFC) 3% -4% -8% 6% -5% -2% -13% -4% -6% Source: Bloomberg
Given current markets conditions in the US, Europe, Asia and emerging economies, the smart trader would want to keep his finger on the pulse for any signs of changes in volatility.
Ready to start trading?
Disclaimer: Articles are from GO Markets analysts and contributors and are based on their independent analysis or personal experiences. Views, opinions or trading styles expressed are their own, and should not be taken as either representative of or shared by GO Markets. Advice, if any, is of a ‘general’ nature and not based on your personal objectives, financial situation or needs. Consider how appropriate the advice, if any, is to your objectives, financial situation and needs, before acting on the advice.
Next Article
Snapshot – NZDCAD, EURUSD, USOIL
NZDCAD - Daily To begin with, let’s take a look at the NZDCAD. Admittedly not the liveliest minor pair but in this instance, I think it is worth a mention. On the daily time frame, we can see the price is hovering around the critical support zone of 0.8850, an area that has been tested three times already this year but has failed to mount any ...
July 27, 2018Read More >Previous Article
‘First Steps in Forex’ – Free Education Course
Why the ‘First Steps in Forex’ course with GO Markets could be just what you are looking for When someone like you has the idea that trading Fore...
July 24, 2018Read More >
- Trading
- Trading
- Trading
- Markets
- Markets
- Products overview
- Forex
- Commodities
- Metals
- Indices
- Share CFDs
- Cryptocurrencies
- Treasuries
- ETFs
- Accounts
- Accounts
- Compare our accounts
- Our spreads
- Funding & withdrawals
- Open CFD account
- Try free demo
- Platforms & tools
- Platforms & tools
- Platforms
- Platforms
- Platforms overview
- TradingView
- MetaTrader 4
- MetaTrader 5
- Mobile trading platforms
- Premium trading tools
- Premium trading tools
- Tools overview
- VPS
- Genesis
- Education
- Education
- Resources
- Resources
- News & analysis
- Education hub
- Economic calendar
- Earnings announcements
- Help & support
- Help & support
- About
- About
- About GO Markets
- Our awards
- Sponsorships
- Client support