- Trading
- Trading
- Markets
- Markets
- Accounts
- Accounts
- Platforms & tools
- Platforms & tools
- Platforms
- Platforms
- Premium trading tools
- Premium trading tools
- Education
- Education
- Resources
- Resources
- Help & support
- Help & support
- About
- About
- Client support
- Trading
- Trading
- Markets
- Markets
- Accounts
- Accounts
- Platforms & tools
- Platforms & tools
- Platforms
- Platforms
- Premium trading tools
- Premium trading tools
- Education
- Education
- Resources
- Resources
- Help & support
- Help & support
- About
- About
- Client support
 News & Analysis
Bollinger Bands – what are they and how can you use them in FX day trading
24 March 2023Bollinger Bands are one of the most popular indicators that FX and CFD traders use, invented in the 1980’s they are a technical analysis tool that are widely used by short and long term traders.
The main uses for Bollinger Bands is determining turning points in the market at oversold and overbought levels and also as a trend following indicator.
Like any technical indicator Bollinger Bands should be used with your own analysis to confirm trades and help set entry and exit levels, they are a fairly simple indicator that focuses on price and volatility only and shouldn’t, in my opinion be used in isolation. While effective, to use them successfully you will need to be aware of the fundamentals and other technical indicators such as major support or resistance levels.
How Bollinger Bands are calculated
Bollinger Bands are composed of three lines. The middle line is a simple moving average (SMA), the default period being 20. The upper and lower bands are the SMA plus or minus 2 standard deviations by default, the SMA period and Deviations can be adjusted in the settings of the indicator if desired, but the standard settings are the most popular settings among traders.
When the price hits the upper band the market could be seen as “overbought” when it hits the lower band it could be seen as “oversold”, they can also be used as levels where trends are confirmed, e.g. hitting upper band could be seen as the start of a strong uptrend and vice versa.
Day Trading strategies using Bollinger Bands
Bollinger Bands are used mainly in two different trading styles, for contrarians looking for overbought and oversold levels to enter fade trades, or confirmation of trend for trend following systems.
Both systems have their pros and cons, as with most indicators it will depend on the market “fee” for the time used, a choppy whipsawing market will see the fading system work very well, a strong trending market will see the trend following system work very well. As with any technical system, the selection of the market to trade and being aware of the fundamentals driving the FX market at that time are critical.. Just had a Fed meeting where they surprised with a 100bp rate hike? Don’t use the fade system on USD pairs!
A good technical system I have found is useful is a mixture of both of these strategies, using the Bollinger Bands to confirm a trend, then using the fading strategy to trade pullbacks of this trend. Lets look at the example below from the AUDNZD – 5 minute chart from the 23rd March 2023
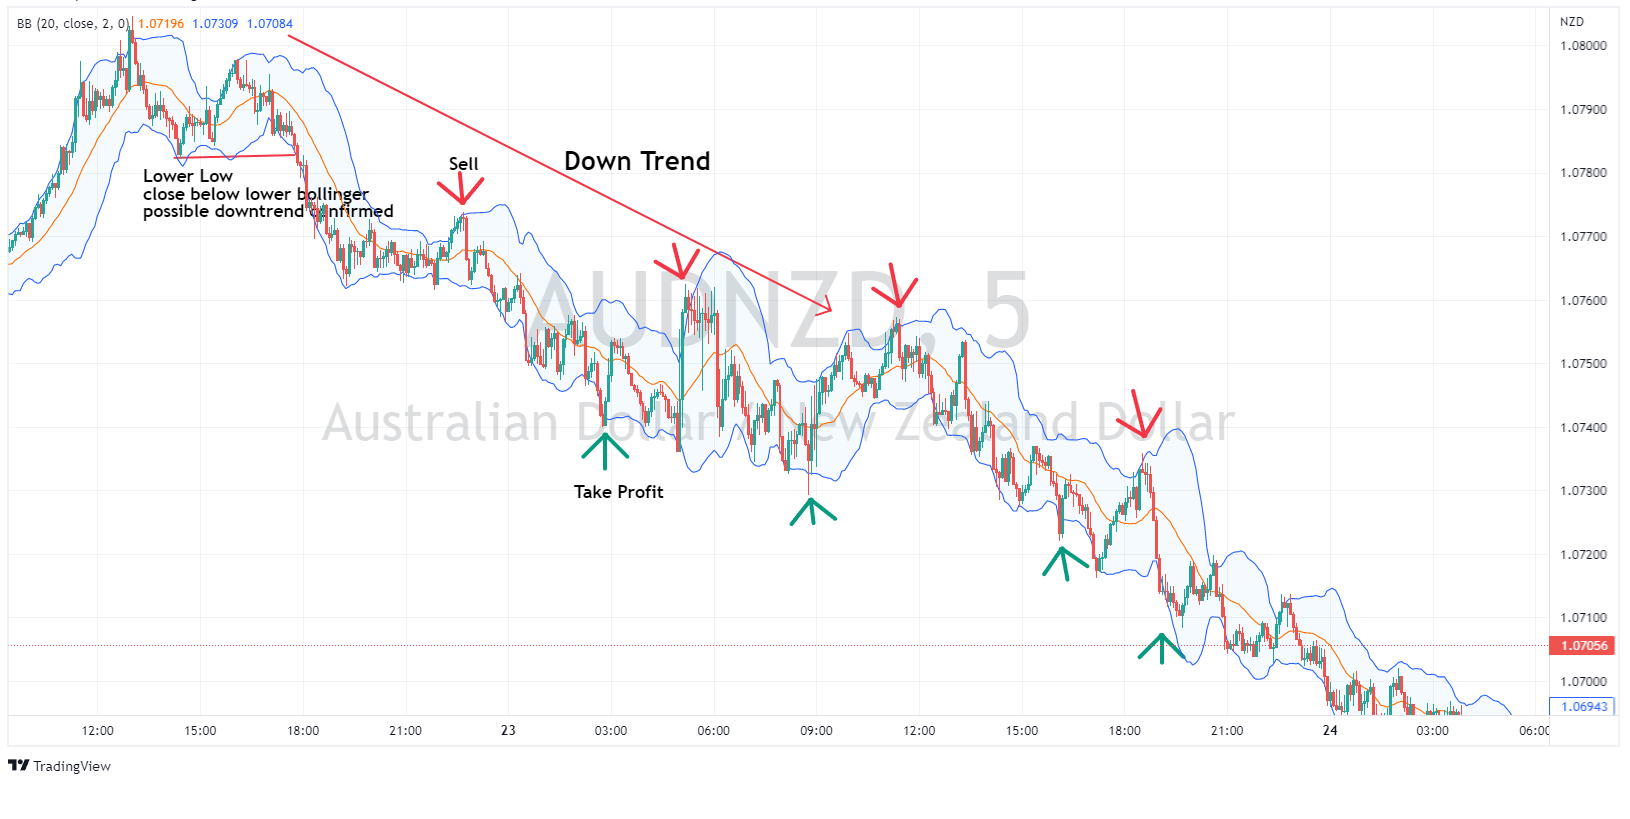
In the above example , which is a common price action across all FX pairs, you would be using the Bolling Bands to confirm a down trend after a close below a major low. Once the possible trend is confirmed, we will be using the “overbought” level of the upper band to enter a short trade, with a take profit exit on 2 closes below the lower band, indicating the market may have gone into “oversold” territory and was time to take some money off the table.
This process would be repeated while lower highs were being made, a close above a major recent high along with a close above the upper Bollinger Band would indicate the trend may have come to an end. This can be seen on the chart below, later in the session on the same pair.
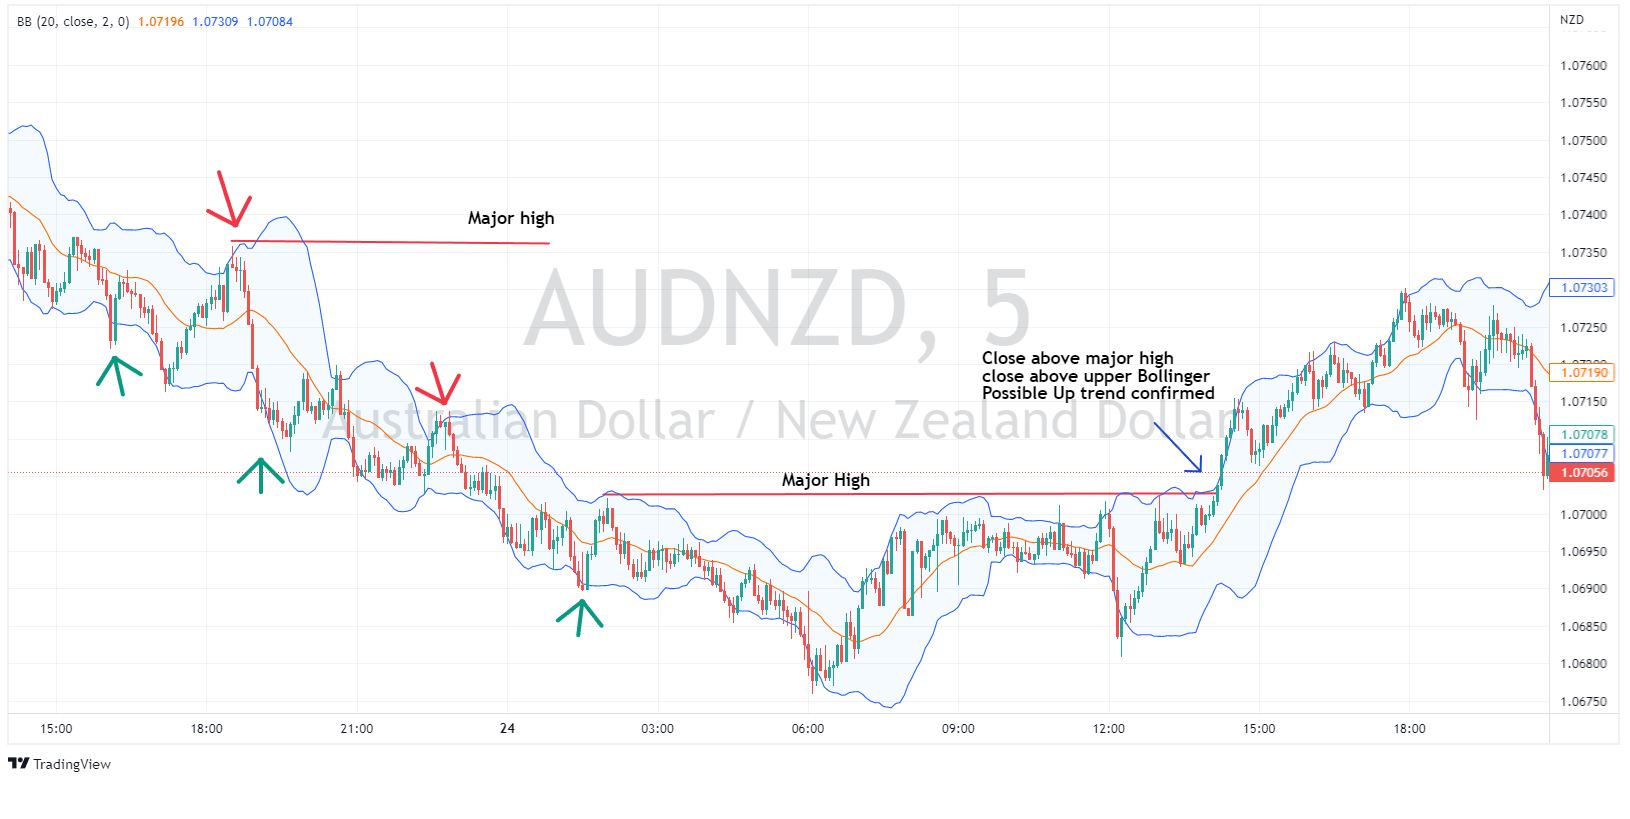
At this point you would exit the short selling of the down trend and reverse to a long bias , or if your analysis on fundamentals were negative for this pair, wait for a new downtrend to form for another shorting run.
The Bollinger Squeeze Strategy
Another strategy popular with FX traders is known as the Bollinger squeeze strategy. A squeeze occurs when the price has a big move, then consolidates in a tight range, this also sees the Bollinger bands go from wide to “squeeze” in a much narrower range, hence the name of the strategy.
A trader would be looking for a breakout and close below or above the Bollinger bands of this squeezed range for a trade entry, see the example below from the EURUSD 5 Minute chart on 23rd of March 2023
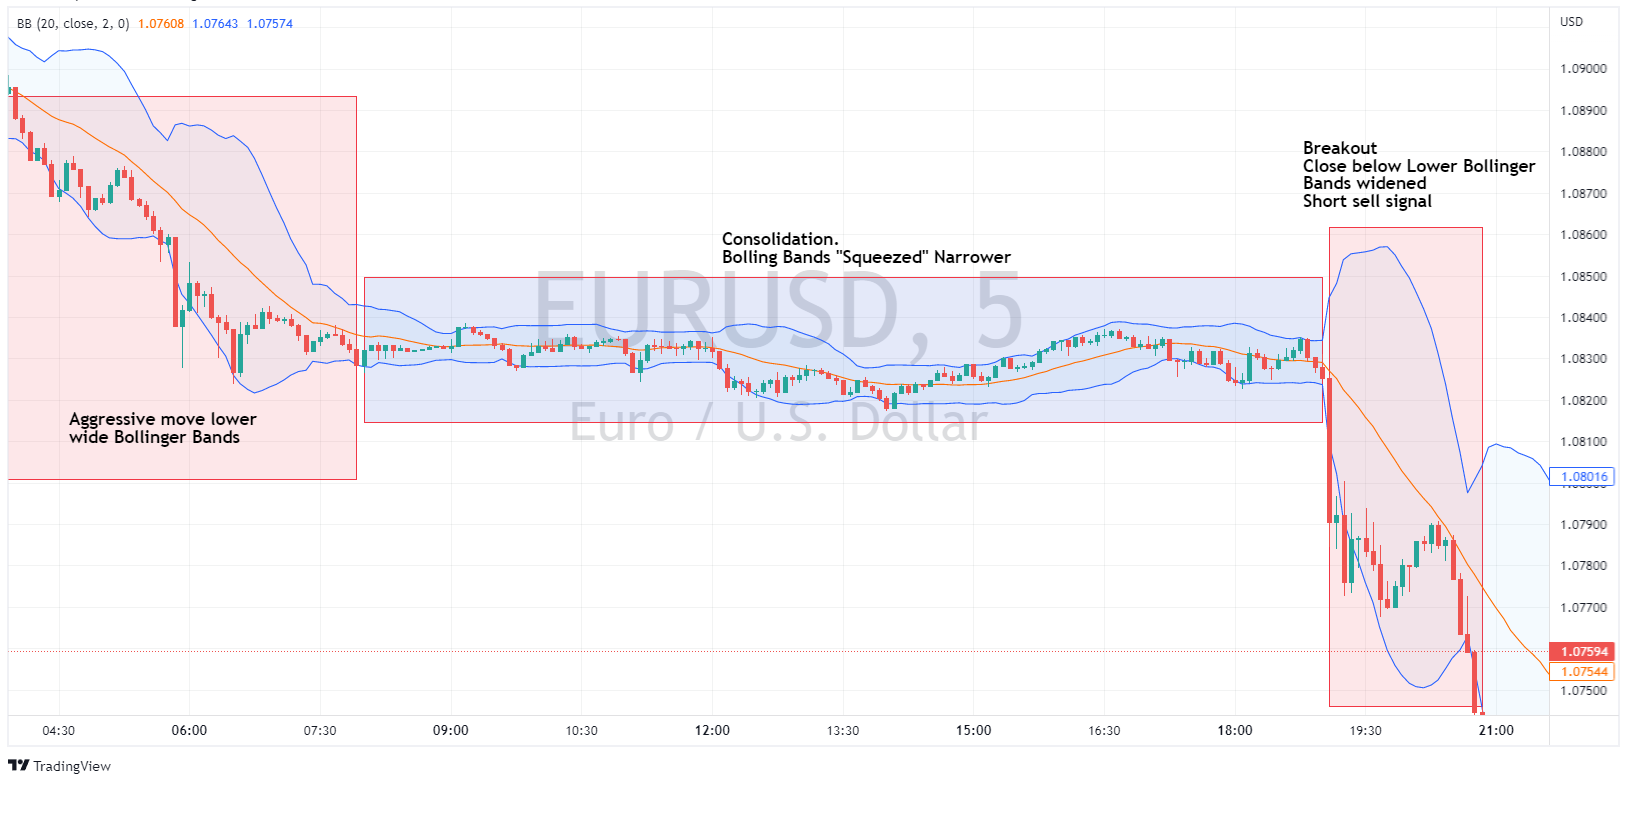
When the price breaks through the upper or lower band after this period of consolidation a buy or a sell signal is generated. An initial stop is traditionally placed just above (or below in a long position) the range of the consolidation. TP rules could be similar to the previous strategy, i.e. multiple closes below the lower Bollinger Bans in the case of a short, or using the middle Bolling Band as a trailing stop in the move is explosive and looks to continue.
Summary
As you can see there are multiple uses for Bollinger Bands in a FX day traders toolbox, including using them for overbought and oversold trade signals in a trending market and the Squeeze strategy where an explosive move often follows a period of consolidation. There are also many more strategies using this indicator which I encourage you to research for yourself.
Ready to start trading?
Disclaimer: Articles are from GO Markets analysts and contributors and are based on their independent analysis or personal experiences. Views, opinions or trading styles expressed are their own, and should not be taken as either representative of or shared by GO Markets. Advice, if any, is of a ‘general’ nature and not based on your personal objectives, financial situation or needs. Consider how appropriate the advice, if any, is to your objectives, financial situation and needs, before acting on the advice.
Next Article
Market Analysis 27-31 March 2023
XAUUSD Analysis 27 – 31 March 2023 The gold price trend can be viewed both positively and negatively in the short and medium term. As the close of last week's Doji bar indicates hesitation in the market. Although the previous three weeks, gold has had strong and consistent buying momentum since the beginning of March. But even so, the g...
March 27, 2023Read More >Previous Article
Red hot inflation in UK points to 25bp hike ,BoE and SNB preview.
Bank of England Headline February inflation in the UK came at a hotter than expected 10.4%, well above the consensus of a drop to 9.9% and indicati...
March 23, 2023Read More >
- Trading
- Trading
- Trading
- Markets
- Markets
- Products overview
- Forex
- Commodities
- Metals
- Indices
- Share CFDs
- Cryptocurrencies
- Treasuries
- ETFs
- Accounts
- Accounts
- Compare our accounts
- Our spreads
- Funding & withdrawals
- Open CFD account
- Try free demo
- Platforms & tools
- Platforms & tools
- Platforms
- Platforms
- Platforms overview
- TradingView
- MetaTrader 4
- MetaTrader 5
- Mobile trading platforms
- Premium trading tools
- Premium trading tools
- Tools overview
- VPS
- Genesis
- Education
- Education
- Resources
- Resources
- News & analysis
- Education hub
- Economic calendar
- Earnings announcements
- Help & support
- Help & support
- About
- About
- About GO Markets
- Our awards
- Sponsorships
- Client support