- Trading
- Trading
- Markets
- Markets
- Accounts
- Accounts
- Platforms & tools
- Platforms & tools
- Platforms
- Platforms
- Premium trading tools
- Premium trading tools
- Education
- Education
- Resources
- Resources
- Help & support
- Help & support
- About
- About
- Client support
- Trading
- Trading
- Markets
- Markets
- Accounts
- Accounts
- Platforms & tools
- Platforms & tools
- Platforms
- Platforms
- Premium trading tools
- Premium trading tools
- Education
- Education
- Resources
- Resources
- Help & support
- Help & support
- About
- About
- Client support
- Price stops making higher highs and instead makes a lower low in an uptrend
- Price stops making lower lows and instead makes a higher high in a downtrend
 News & Analysis
Understanding the Break of Market Structure
25 August 2025Even during the strongest of market trends, prices do not move in straight lines for long.
Nor do they move in random lines. Price structure has a tendency to be more like a wave, creating a visual rhythm on a chart.
You can think of market structure as the framework on which all price action sits. If you can read structure clearly, it helps everything else make more sense and adds more weight to your decision-making.
Key Principles of Market Structure
Trends vs. Ranges
What you see on a chart is a reflection of sentiment toward the asset you are looking at in real time.
Markets will either be trending (moving in one direction for a period of time) or ranging (moving sideways between two price points).
A trend shows a strong imbalance between buyers and sellers, while a range shows balance and potential uncertainty about what should happen next.
Recognising which environment the price action is in is vital. Trend strategies will often fail in a range, and range strategies will often be punished in a strong trend.
Swing Points
Swing highs and lows are fundamental pieces of price information and are the turning points of price.
In an uptrend, the market trend builds with higher swing highs and higher swing lows. In a downtrend, it does the opposite.
These points help traders map the direction and strength of a move. A failure to form the expected swing can be an early warning sign of change — a ‘break of market structure’.
Support and Resistance
Past swing levels often act as areas where traders make decisions. A prior swing high may act as resistance (a ceiling where price struggles to break higher), and a prior swing low may act as support (a floor where price struggles to break lower).
This happens because many orders — stops, entries, or take-profits — are clustered at these levels.
Order Flow Reflection
Market structure is a reflection of order flow. Simple supply and demand based on the perception that an asset is under- or overpriced compared to its valuation.
This is a battle between buyers and sellers over a succession of candles on the chosen timeframe you are looking at.
If a series of higher highs is being made, it shows that sentiment-driven buying pressure is consistently strong enough to push prices to new levels.
If that rhythm breaks, it tells us something has changed in the underlying supply/demand balance.
Fractality
The strongest structure (arguably) is fractal. What looks like potential noise or range forming on a daily chart may be a clear structure on a 30-minute chart, and vice versa.
Imagine you have a group of 100 traders. 25 trade a 15-minute chart, 25 trade an hourly, 25 trade a 4-hourly, and 25 trade a daily.
That means a confirmed trade on one timeframe has 25 interested participants, whereas if there is agreement on three, you have 75 traders about to press the entry button.
In practical terms, a common approach is to use one or more higher timeframes for context and a short timeframe for entry.
The image below shows an uptrend with higher highs and higher lows marked in green and red circles as the trend develops, and then a final breach of the previous swing low — a break of market structure.
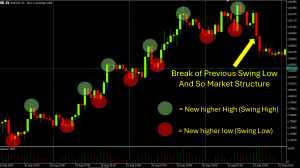
Chart showing the break of market structure What Is a Break of Market Structure?
A Break of Market Structure (BOS) happens when the price no longer follows the established rhythm it has been in for a period of time.
Break of Market structure involves either:
This is the first sign that the “previous market story” that has brought the price to its current level may no longer apply.
However, this doesn’t guarantee a full reversal. It may just see price move into a rangebound or sideways holding pattern until more information comes to the market.
The bottom line is that it could be a critical clue that the balance of power between buyers and sellers has now shifted.
With open trades you may have, it could be the time to consider exiting and moving into something else that is showing a new trend or continuation using the same market structure principles.
Why Is BOS Important to Traders?
Early Warning of Reversal
A BOS can be the very first sign that a trend is ending. Catching the shift early means avoiding overstaying in a trade or getting ready to position yourself for a potential trade in a new direction.
Of course, this is a “get ready” and you would only take action when all confluence factors are in place as per your trading plan. i.e., don’t assume it is good until there is evidence that it is actually happening.
Liquidity Insight
Stop clusters are areas where many traders place their stop-loss orders, place profit targets, and where pending orders for entry may also be sitting.
Many automated trading models are also primed to take action on a break of market structure within their coding.
All of these can create pauses or reversals. Once these have all been swept away, this can be a signal of a BOS, and new momentum may be emerging.
This can create a “liquidity sweep.” A liquidity sweep occurs when the price pushes temporarily beyond a swing high/low, triggering stops and attracting breakout traders, before snapping back the other way.
In charting terms, you may see a one or two-candle “probe” beyond a key level before reversing.
In practical terms, you can account for this in your decision-making by (for example) giving a little space below a previous swing high/low.
Helps Manage Risk
If you’re in a trend trade, a BOS against your position tells you to tighten stops, scale out, or exit. It’s a clear signal that your initial trading idea may no longer be valid, or it might be time to lock in any profits.
Framework for Strategy
Many discretionary traders and automated model builders create whole strategies around BOS events. For example, entering after a liquidity sweep and break, or waiting for retests of the broken market structure levels.
Final Thoughts
Market structure can give you a useful trading map of the evolution of sentiment behind a price move.
Understanding this can help you define and act upon a break of structure, which is telling you when the map has changed (or is about to).
By developing a greater understanding of the principles of structure, learning what BOS means in practice, and recognising related concepts like stop clusters and liquidity sweeps, traders can gain invaluable insights that help them take practical action to take for entry and exit decision-making.
The reality is that most effective strategies will have these principles at their base. A BOS, especially when confirmed with context and market character, is one of the clearest signs of that shift.
Ready to start trading?
Disclaimer: Articles are from GO Markets analysts and contributors and are based on their independent analysis or personal experiences. Views, opinions or trading styles expressed are their own, and should not be taken as either representative of or shared by GO Markets. Advice, if any, is of a ‘general’ nature and not based on your personal objectives, financial situation or needs. Consider how appropriate the advice, if any, is to your objectives, financial situation and needs, before acting on the advice.
Next Article
Understanding Change in Market Character (CIMC)
Market Character is the big sister of Market Structure. While Market Structure can show the framework of price highs and lows, Market Character reveals the behaviour of price moves in greater detail. Market character takes into account the speed of price movement, changing volatility, and the level of conviction behind the move. The combinati...
August 27, 2025Read More >Previous Article
The Magnificent Seven’s $385 Billion AI War
The “Magnificent Seven” technology companies are expected to invest a combined $385 billion into AI by the end of 2025. Each of the Seven is tr...
August 22, 2025Read More >
- Trading
- Trading
- Trading
- Markets
- Markets
- Products overview
- Forex
- Commodities
- Metals
- Indices
- Share CFDs
- Cryptocurrencies
- Treasuries
- ETFs
- Accounts
- Accounts
- Compare our accounts
- Our spreads
- Funding & withdrawals
- Open CFD account
- Try free demo
- Platforms & tools
- Platforms & tools
- Platforms
- Platforms
- Platforms overview
- TradingView
- MetaTrader 4
- MetaTrader 5
- Mobile trading platforms
- Premium trading tools
- Premium trading tools
- Tools overview
- VPS
- Genesis
- Education
- Education
- Resources
- Resources
- News & analysis
- Education hub
- Economic calendar
- Earnings announcements
- Help & support
- Help & support
- About
- About
- About GO Markets
- Our awards
- Sponsorships
- Client support