- Trading
- Trading
- Markets
- Markets
- Accounts
- Accounts
- Platforms & tools
- Platforms & tools
- Platforms
- Platforms
- Premium trading tools
- Premium trading tools
- Education
- Education
- Resources
- Resources
- Help & support
- Help & support
- About
- About
- Client support
- Trading
- Trading
- Markets
- Markets
- Accounts
- Accounts
- Platforms & tools
- Platforms & tools
- Platforms
- Platforms
- Premium trading tools
- Premium trading tools
- Education
- Education
- Resources
- Resources
- Help & support
- Help & support
- About
- About
- Client support
- The tendency for prior resistance to become support, and prior support to become resistance.
- Several key-level breakout price moves will offer a challenge to the strength of a move by retesting the key level just breached, before continuing a move in the breakout direction.
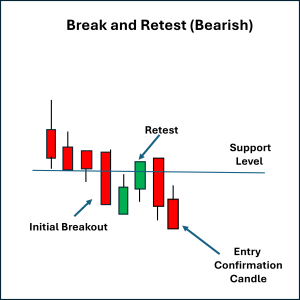
- A: Break → price pushes decisively below a support level, showing strong seller control.
- B: Retest → price rallies back to the broken support, which now holds as resistance.
- C: Confirmation → the retest is rejected, and a bearish candle close beneath the low of the initial breakout candle is seen. This pattern suggests buyers are unable to reclaim the level, confirming that the balance of power remains with the sellers.
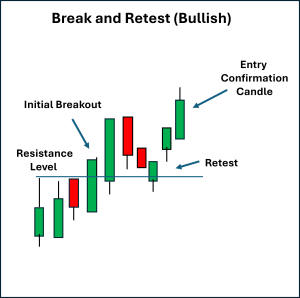
- A: Break → price surges through resistance, showing strong buyer conviction.
- B: Retest → price pulls back to the broken level, which now holds as support.
- C: Confirmation → the retest of the key level is rejected, and a bullish candle close above the high of the initial breakout candle is seen. This pattern suggests sellers are unable to reclaim the level, confirming that the balance of power remains with the buyers.
- For bearish setups, stops are commonly placed just above the retest candle high of the original support zone.
- For bullish setups, stops are typically set just below the retest candle low of the previous resistance zone.
- Using fixed risk-to-reward targets, often 2:1 or better.
- Profit targets may be set near the next key level in the direction of the new trend
- Employing trailing stops to capture extended runs after strong breakouts.
 News & Analysis
The Break and Retest – Trading Setups
24 September 2025What Is the Break and Retest?
The “Break and Retest” is a common price action setup based on two important principles:
Psychologically, this price action indicates market control as the breakout is confirmed, and a new trend may be in play.
Essentially, the retest level can be thought of as a battleground. It is asking questions of the conviction of a potential sentiment change, so a new directional move can begin.
Bearish Break and Retest
A bearish setup occurs when support is broken to the downside, and price then retests the former support level, which now acts as resistance.
This reflects an inability of the buyers to force price back above the broken level, while the sellers use the retest and subsequent continuation to confirm the move
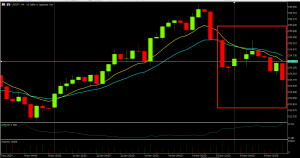
You can see a real chart example of this on the 4-hourly USDJPY, where a previous support level was breached, then retested before the confirmation of a downwards continuation was seen.
Bullish Break and Retest
A bullish setup occurs when resistance is broken to the upside, and price then retests the former resistance, which now acts as support.
This sequence reflects sellers being unable to force price back below the broken level, while buyers use the retest to confirm the move.
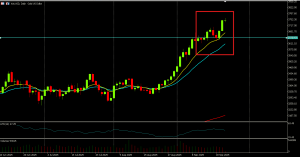
You can see a real chart example of this on the daily gold futures CFD (XAUUSD), where a broken resistance level is retested prior to seeing uptrend confirmation with the price breaching the initial breakout candle high.
Stop Placement and Exits
Risk management for the Break and Retest often focuses on the retest zone itself:
Profit-taking exit approaches can include:
Final Thoughts
The Break and Retest combines a decisive breakout move with a clear technical retest and confirmation, allowing traders to join a trend at a defined confirmation point with structured and logical stop placement.
The psychology is rooted in how market participants react to broken levels and the desire to see conviction before committing to increases in volume and momentum.
This setup is commonly used by many traders as it avoids “chasing” the first breakout candle and offers a new and potentially stronger confirmation of the robustness of a new trend.
As always, confluence factors such as increased volume, overall trend direction, and proximity to other key market levels can add confidence in the potential for continuation of the price action move.
If you want to take the first steps on adding this to your trading toolbox, have a look at charts and see the frequency of this scenario, as well as track charts that exhibit this move to see what happens next.
Ready to start trading?
Disclaimer: Articles are from GO Markets analysts and contributors and are based on their independent analysis or personal experiences. Views, opinions or trading styles expressed are their own, and should not be taken as either representative of or shared by GO Markets. Advice, if any, is of a ‘general’ nature and not based on your personal objectives, financial situation or needs. Consider how appropriate the advice, if any, is to your objectives, financial situation and needs, before acting on the advice.
Next Article
10 Professional Trading Standards: The Foundation of Trading Planning and Behaviour
Before a trader defines their strategy or chooses their markets, they must decide how they plan to conduct themselves. A trading strategy should be underpinned by a set of standards and behaviours that guide every decision and approach. Establishing professional standards can provide a framework for consistency and personal accountability...
September 29, 2025Read More >Previous Article
The Inside Bar Breakout – Trading Setups
The Inside Bar breakout is a price action setup that indicates a short-term consolidation within the broader context of an existing trend — and a po...
September 19, 2025Read More >
- Trading
- Trading
- Trading
- Markets
- Markets
- Products overview
- Forex
- Commodities
- Metals
- Indices
- Share CFDs
- Cryptocurrencies
- Treasuries
- ETFs
- Accounts
- Accounts
- Compare our accounts
- Our spreads
- Funding & withdrawals
- Open CFD account
- Try free demo
- Platforms & tools
- Platforms & tools
- Platforms
- Platforms
- Platforms overview
- TradingView
- MetaTrader 4
- MetaTrader 5
- Mobile trading platforms
- Premium trading tools
- Premium trading tools
- Tools overview
- VPS
- Genesis
- Education
- Education
- Resources
- Resources
- News & analysis
- Education hub
- Economic calendar
- Earnings announcements
- Help & support
- Help & support
- About
- About
- About GO Markets
- Our awards
- Sponsorships
- Client support