
Crude Oil Trading with CFD’s – how to speculate on black gold
9 May 2023Crude Oil has always been one of the most popular and highly traded markets for CFD traders whether it is WTI or Brent, especially recently as geopolitical and economic forces have seen its price fluctuate from extreme lows to extreme highs. It’s easy to see why, Oil is a bellwether for the health of the global market, oil greases the wheels of global commerce and with CFDs it’s possible to take a position in this exciting market, whether you think the price will head up or down.
In this CFD Oil trading Article we will look at the following:
- How to use CFDs to trade oil
- Fundamental forces that drive the price of oil
- Popular technical strategies for trading oil CFDs
How to use CFDs to trade oil
CFDs or Contracts For Difference allow you to speculate on the price of oil, without owning the underlying asset. A spot oil CFD tracks the price of the spot market being the cleanest and most efficient way to speculate on the price of oil.
They also allow you to take a position in both directions, you would enter a buy (Long) positions if you believed the price will rise, or a sell (Short) position if you believe the price will fall.
With Long positions you are looking to buy and sell at a higher price at a later time to profit on the trade. With a Short position you are selling with the view to buy back at a later time to profit on the trade.
At GO Markets we offer our clients the worlds most popular oil trading platform in Metatrader 4 and 5, another advantage to these CFD trading platforms is the ability to automate oil trading strategies.
Other advantages to trading oil CFDs with GO Markets:
- Trade 23 hours a day on WTI oil, 21 hours a day on Brent oil, unlike an ETF or oil company listed on a stock exchange that is only open while that stock exchange is open.
- Leverage – the margin required to open the trade will be a fraction of the face value of the position depending on what leverage you are comfortable with.
- Flexibility in position sizing starting from 0.1 lot ($0.10 USD per point movement in oil) unlike oil futures which have rigid contract sizes.
- Rolling contract, no expiries such as in options or futures to worry about.
To Enter a position in Metatrader, you would bring up a deal ticket by clicking “New Order” then select your position size, any Stop Loss or Take Profit levels you want the position to automatically close at and hit Buy or Sell.
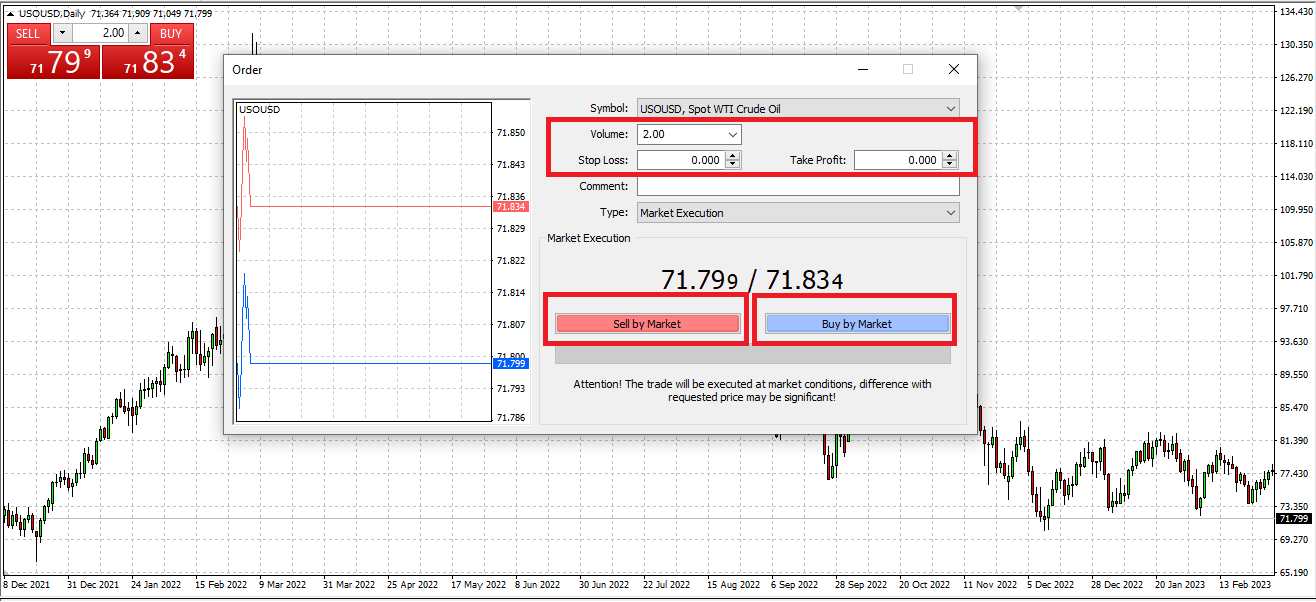
As with any instrument, make sure you are familiar with the lot sizing. 1 standard lot in oil (USOUSD and UKOUSD) is 100 barrels, or $1 USD a point so make sure you set the volume to a level commensurate to your account size and risk appetite.
Now, the next question is how you decide on a buy or sell, let’s look at the fundamentals of what drives oil and some technical analysis you can use to answer this question.
Fundamental forces that drive the price of oil
Both WTI oil (USOUSD) and Brent Oil (UKOUSD) are highly correlated and will both be referenced as “oil” in the below.
While no one reason can be fully attributed to movements in the price of oil, there are an important few fundamental drivers that will influence the price and whose relationship has been time tested. None of these on their own should be used as a sole reason to enter a position, but having the fundamentals on your side will certainly give you an advantage.
The main fundamental drivers in my experience are
- The perceived health of the global economy
- OPEC+ production cuts or increases
- Geopolitical issues
The perceived health of the global economy
Oil is the driver of commerce, it is needed for the transport and manufacturing of goods and getting people around. If economic conditions are deteriorating, it means less economic activity and the need for less oil sending the price down. A global economy which is seen as “hot” means more economic activity and more demand for oil, seeing it’s price increase. A clear chart to see this is the price of oil as compared to the US 10-year bond yield over the years. You can see the price of oil and the yield are highly correlated, this is due to yields going up when the economy is “hot” and yields falling when the economy enters a period of contraction, similar price drivers to oil. The black line is WTI oil price, the orange US 10-year yields going back 10 years.
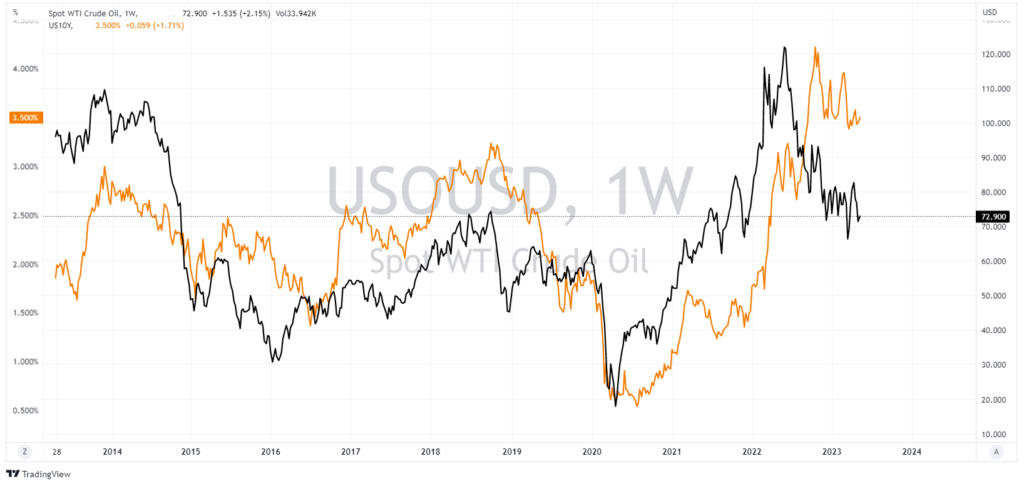
Source: tradingview.com
OPEC+ production cuts or increases
The Organization of the Petroleum Exporting Countries (OPEC) is a cartel of leading oil-producing countries formed in order to collectively influence the global oil market. OPEC started with a handful of Middle Eastern oil producers in 1960, and has since grown to 24 members in OPEC+. Even thought the USA is currently the worlds top oil producer, OPEC+ countries as a whole still dominate global oil supply and decisions made by the cartel can have a dramatic influence on the price of crude oil.
Market share of oil producing nations:
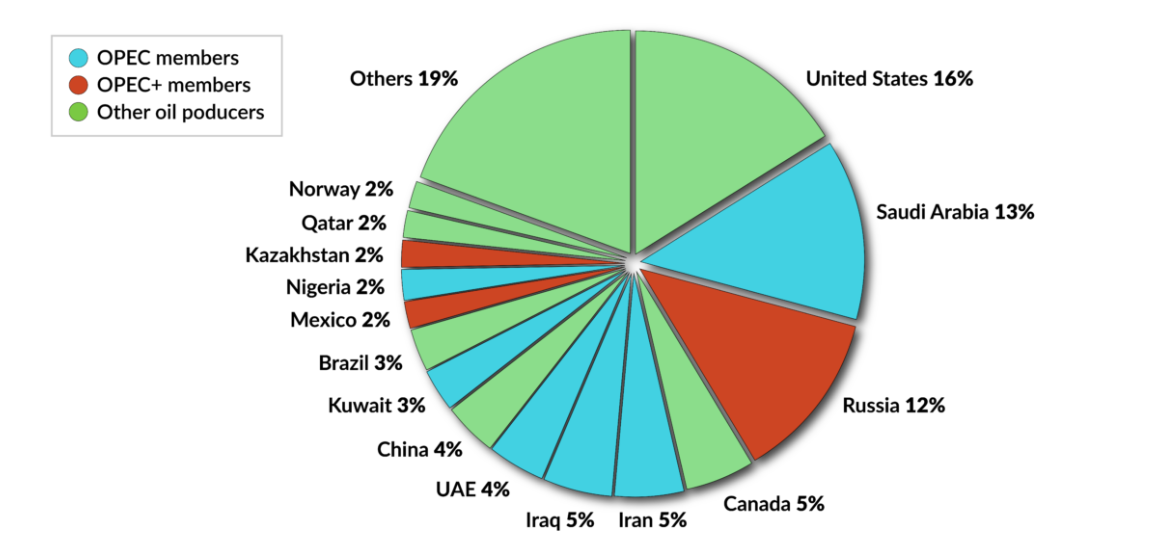
Source: gisreportsonline.com
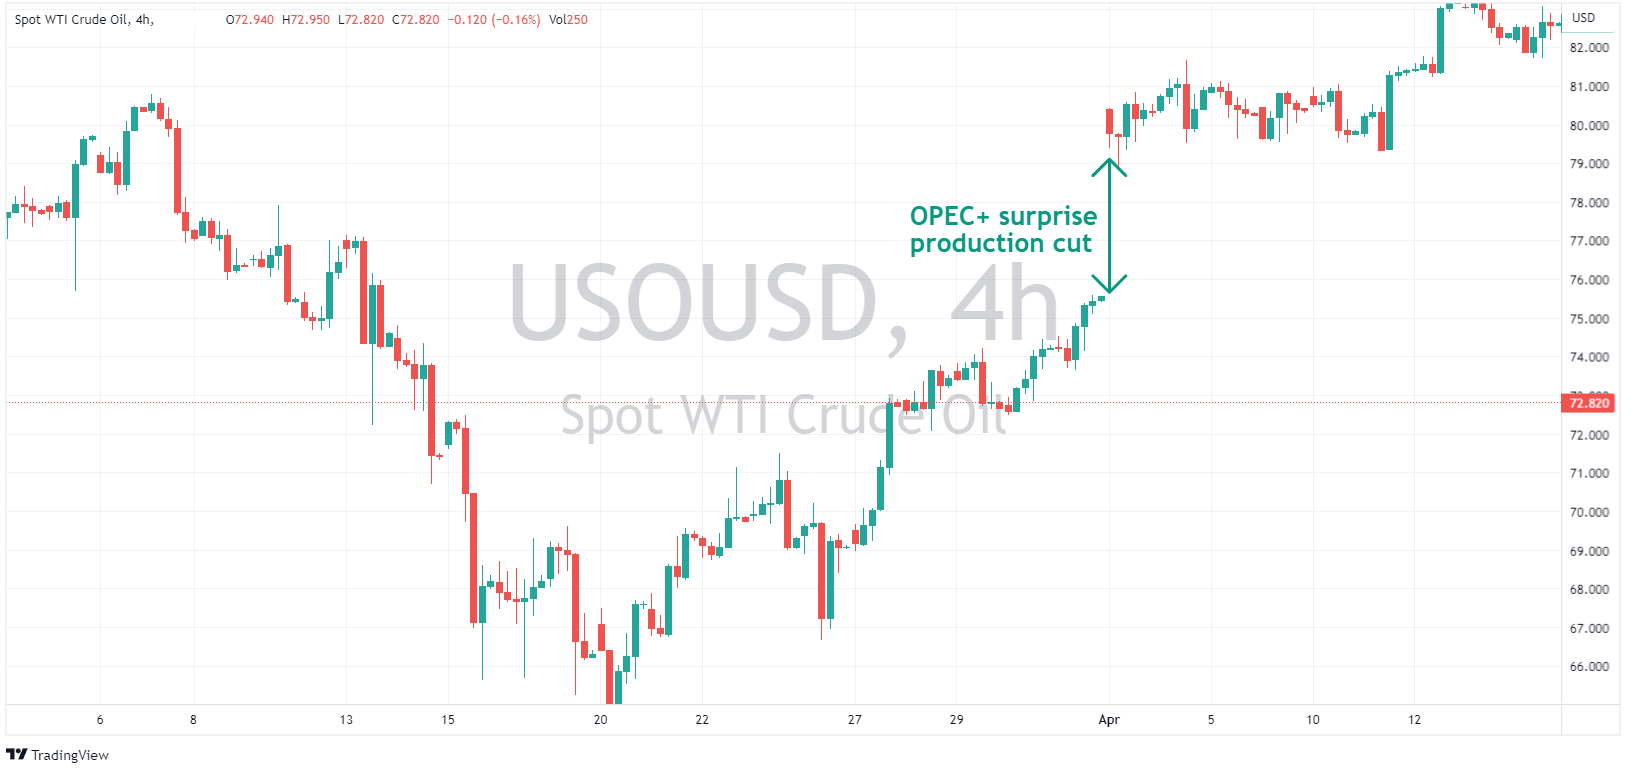
OPEC+ hold regular meetings during the year, normally the expected result is well telegraphed, but sometimes there can be a surprise, such as at their latest meeting on Sunday April 2nd, 2023, where a surprise production cut was announced, seeing the price of oil gap significantly higher on Mondays open, showing oil traders to always approach these meetings with caution.
Geopolitical issues
The last three years has seen some very influential geopolitical events, or “black swans” and oil being closely tied to the health of the global economy has seen some very big moves on the back of these events. The Pandemic and its related lock downs and slowing of global commerce saw the price of oil slump to all time lows, followed by the war in Ukraine which saw oil jump to multi year highs on the fear of supply disruptions (Russia is the second biggest oil producer in the world)
The chart below illustrates this:
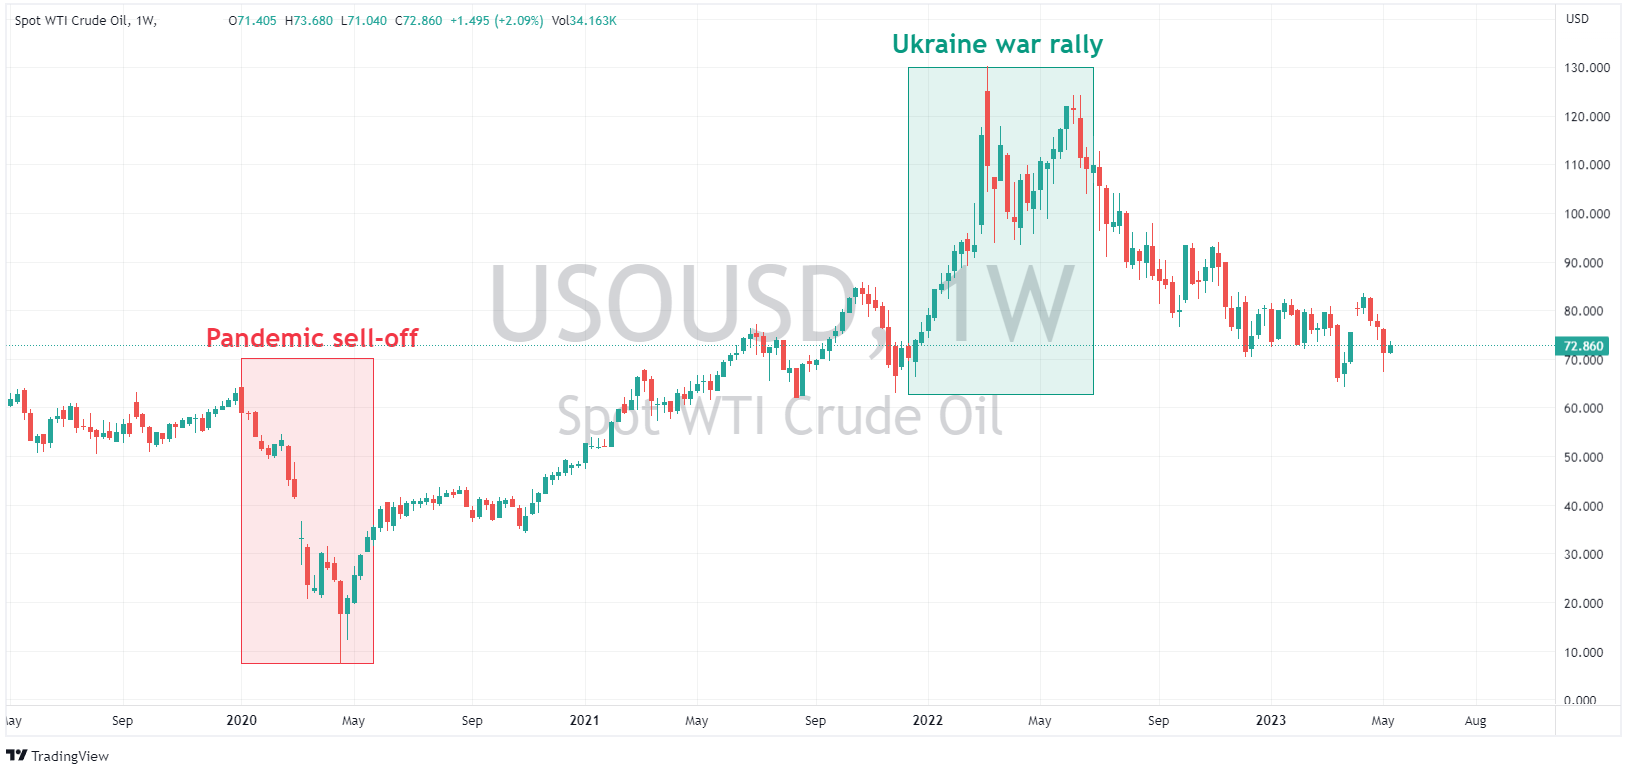
Oil traders especially need to be aware of geopolitical risks as the above chart shows.
Technical strategies for trading oil CFDs
While having a good understanding of the fundamentals (in my opinion) is important to help you choose the best trades most traders will use a combination of technical analysis and fundamentals with the aim for higher probability outcomes in their trades. Some traders will use technical analysis exclusively without any interest in the fundamental drivers using things such as RSI oscillators, support and resistance areas and trend lines solely to decide on their trade direction. Which option is best is solely up to the trader, their time frames for the trades and risk appetite, all can work, and all can fail neither option can be seen as “better” than the other, it all depends on the individual trader.
Technical analysis is an art in itself and there is a lot to learn on this subject, I encourage anyone interested to research the many weird and wonderful technical analysis strategies that are documented online. But let’s take a look at a popular technical indicators that oil traders use to make their trades.
Support and Resistance
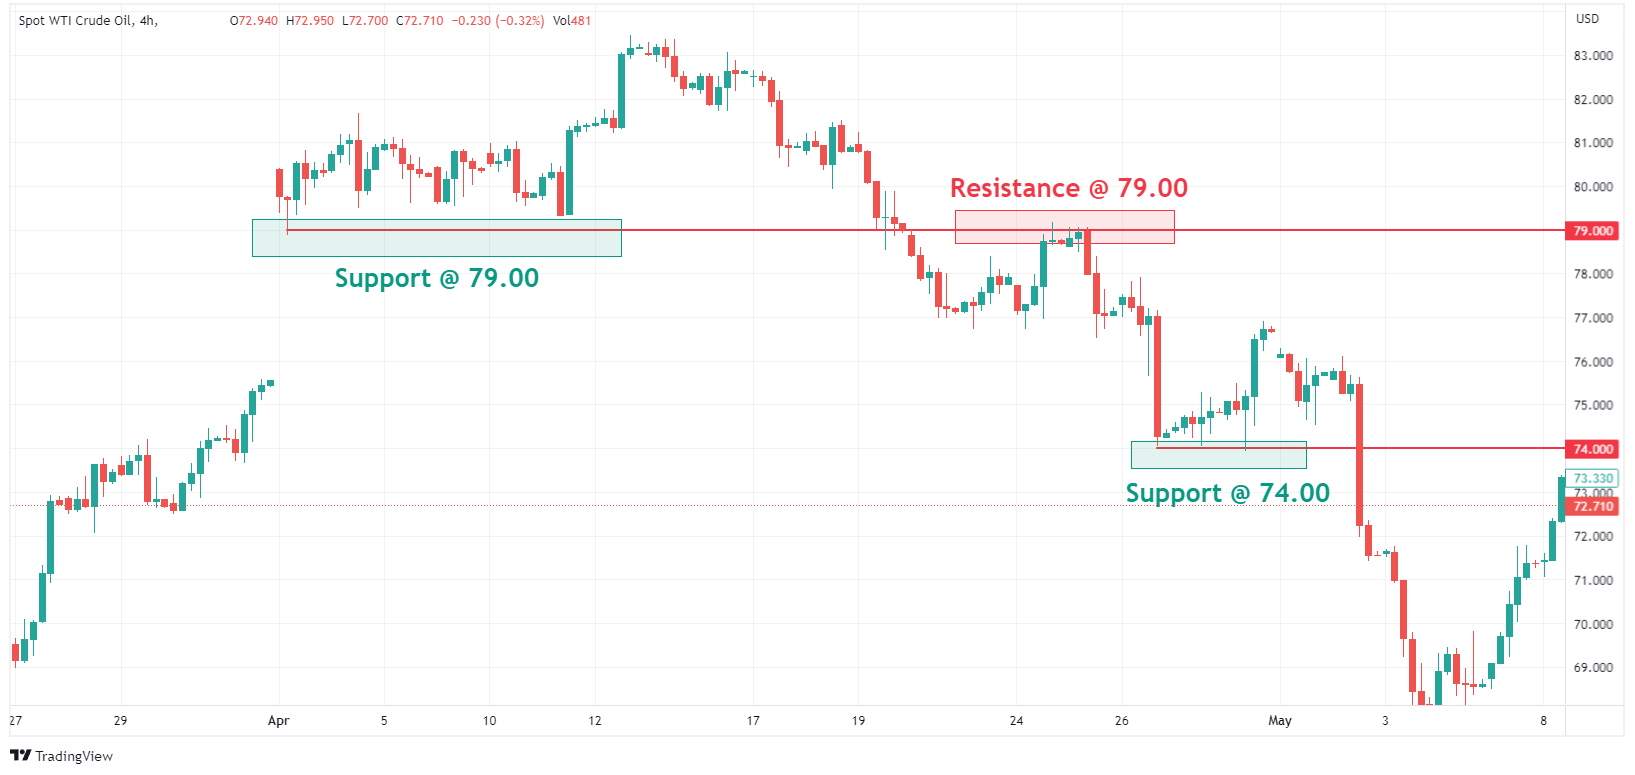
Support and resistance are one of the most widely used and accurate (when used correctly) technical indicators that can be used by traders. Support and Resistance areas are points in the market where the price is held from going lower (Support) or going higher (Resistance), these are areas where buyers or sellers are entering the market as they see value in the asset at that price. These levels can last a long time or be temporary and can be used to predict turn arounds in the market, or a break of these levels could indicate a further push in that direction. Oil is also particularly sensitive to psychological levels around “big figures” or rounded number, e.g. 79.00 and 74.00 As can be seen on the chart below.
Hopefully this article has given you an interest to learn more about trading oil with CFDs. Feel free to contact the GO Markets team if you have any questions on trading oil CFDs and opening an account with us.
Disclaimer: Articles are from GO Markets analysts and contributors and are based on their independent analysis or personal experiences. Views, opinions or trading styles expressed are their own, and should not be taken as either representative of or shared by GO Markets. Advice, if any, is of a ‘general’ nature and not based on your personal objectives, financial situation or needs. Consider how appropriate the advice, if any, is to your objectives, financial situation and needs, before acting on the advice.
Next Article
US stocks fall ahead of CPI, Hawkish Central bank speak and debt limit limbo
US indices finished modestly lower on a light news day with traders cautious ahead of upcoming US CPI figures and following hawkish rhetoric from numerous ECB and Fed officials. There is also the US debt limit negotiations on the back of traders’ minds as agreement remains in limbo and talks look likely to be protracted. The Dow Jones was down...
Previous Article
Market Analysis 8-12 May 2023
XAUUSD Analysis 8 – 12 May 2023 The gold price outlook is positive in the medium term. Although last week's closing of the buying pressure ba...